ENTERTAINMENT
Legendary Stars of Psych TV Show Cast 2024

Psych is an American detective comedy-drama television series that aired on the USA Network from 2006 to 2014. Created by Steve Franks, the show follows Shawn Spencer, a young crime consultant for the Santa Barbara Police Department, who convinces people he solves cases with his psychic abilities, though he actually uses his heightened observational skills. The series is renowned for its witty humor, clever plotlines, and, notably, its dynamic ensemble cast.
Main Stars of Psych Cast
Shawn Spencer
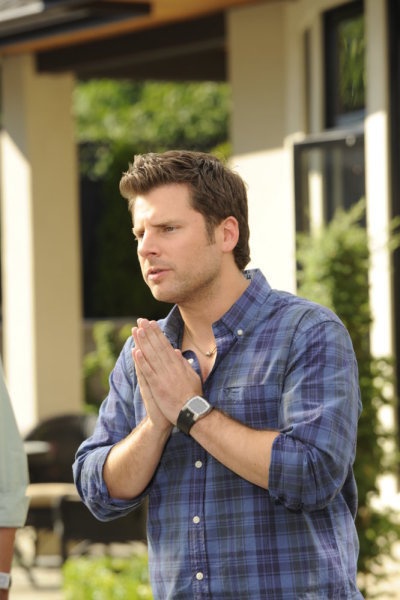
Portrayed by James Roday Rodriguez, Shawn Spencer is the protagonist of the series. Gifted with exceptional observational skills and an eidetic memory, Shawn pretends to be a psychic detective, assisting the police in solving crimes. His charismatic and playful nature often leads to humorous situations, making him a beloved character among fans.
Burton “Gus” Guster

Dulé Hill plays Burton “Gus” Guster, Shawn’s best friend since childhood and reluctant partner in the psychic detective agency. Gus is a pharmaceutical salesman with a keen sense of responsibility, often serving as the voice of reason to Shawn’s antics. Their chemistry provides a strong backbone to the series, blending comedy with heartfelt friendship.
Carlton “Lassie” Lassiter

Timothy Omundson portrays Carlton Lassiter, the stern head detective of the Santa Barbara Police Department. Initially skeptical of Shawn’s psychic abilities, Lassiter’s character develops a begrudging respect for Shawn and Gus over time. His rigid demeanor juxtaposed with the duo’s antics adds depth to the show’s dynamic.
Juliet “Jules” O’Hara

Maggie Lawson plays Juliet O’Hara, a junior detective who becomes Shawn’s love interest. Intelligent, determined, and compassionate, Juliet’s character brings both romantic and professional dimensions to the series, enriching the narrative with her evolving relationship with Shawn.
Henry Spencer

Corbin Bernsen portrays Henry Spencer, Shawn’s father and a retired police officer. Henry’s strict upbringing and emphasis on observational skills significantly influence Shawn’s abilities. Their father-son relationship adds an emotional layer to the series, exploring themes of expectation and reconciliation.
Chief Karen Vick

Kirsten Nelson plays Chief Karen Vick, the interim chief of the Santa Barbara Police Department. Supportive yet authoritative, Chief Vick often mediates between the department’s skepticism and Shawn’s unconventional methods, maintaining balance within the investigative team.
Recurring Characters
Buzz McNab
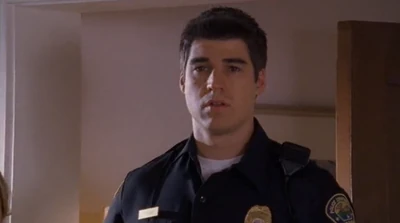
Sage Brocklebank portrays Officer Buzz McNab, a uniformed officer who frequently assists Shawn and Gus. His cheerful disposition and willingness to help make him a recurring favorite throughout the series.
Woody the Coroner

Kurt Fuller plays Woody Strode, the quirky coroner with a macabre sense of humor. Woody’s peculiar personality and unconventional methods provide additional comic relief, contributing to the show’s unique charm.
Marlowe Viccellio

Kristy Swanson portrays Marlowe Viccellio, who becomes Lassiter’s love interest and later his wife. Her character adds depth to Lassiter’s storyline, revealing a more personal side of the typically stoic detective.
Notable Guest Stars

Psych featured numerous guest stars who left a lasting impact on the series.
Pierre Despereaux

Cary Elwes guest stars as Pierre Despereaux, an elusive art thief and Shawn’s occasional nemesis. His charm and wit make his episodes particularly memorable, adding an element of intrigue to the series.
Mr. Yang

Ally Sheedy portrays Mr. Yang, a mysterious serial killer with a personal vendetta against Shawn. Her appearances introduce a darker, suspenseful tone, showcasing the show’s versatility in blending genres.
Frank O’Hara

William Shatner guest stars as Frank O’Hara, Juliet’s estranged father. His character adds complexity to Juliet’s backstory, exploring familial relationships and personal growth.
The Chemistry Among the Cast
The success of Psych can be largely attributed to the chemistry among its cast members. The seamless interactions and genuine camaraderie between the actors translate into authentic on-screen relationships, enhancing the show’s appeal. The blend of humor, drama, and character development creates a compelling narrative that resonates with audiences.
Post-Psych Endeavors
After the series concluded, the main cast members pursued various projects, showcasing their versatility and talent.
- James Roday Rodriguez continued his acting career and took on roles in series such as A Million Little Things, further establishing his presence in the television industry.
- Dulé Hill appeared in several television series, including Suits and The Wonder Years, demonstrating his adaptability across genres.
- Timothy Omundson faced health challenges but made a remarkable return to acting, appearing in shows like This Is Us, inspiring fans with his resilience.
- Maggie Lawson featured in various television projects, including Lethal Weapon and Santa Clarita Diet, continuing to captivate audiences with her performances.
- Corbin Bernsen took on diverse roles in series such as The Resident and City on a Hill, showcasing his enduring talent in the industry.
- Kirsten Nelson appeared in guest roles on shows like NCIS: New Orleans and This Is Us, maintaining her presence on television.
Psych: The Legacy Continues
The enduring popularity of Psych led to the creation of several television movies, allowing fans to reconnect with their favorite characters.
- Psych: The Movie (2017) reunited the original cast for a new adventure, delighting long-time fans with fresh content.
- Psych 2: Lassie Come Home (2020) focused on Lassiter’s character, providing a heartfelt narrative that resonated with audiences.
- Psych 3: This Is Gus (2021) continued the tradition of blending humor and mystery, further expanding the Psych universe.
These continuations highlight the lasting impact of the series and the strong fanbase that supports it.
Conclusion
The Psych TV series cast brought to life a unique blend of comedy and drama, creating a show that remains beloved by fans worldwide. Their dynamic performances and the chemistry among the ensemble cast contributed significantly to the show’s success and enduring legacy. Whether you’re a long-time fan or new to the series, exploring the world of Psych offers a delightful experience filled with humor, mystery, and memorable characters.
ENTERTAINMENT
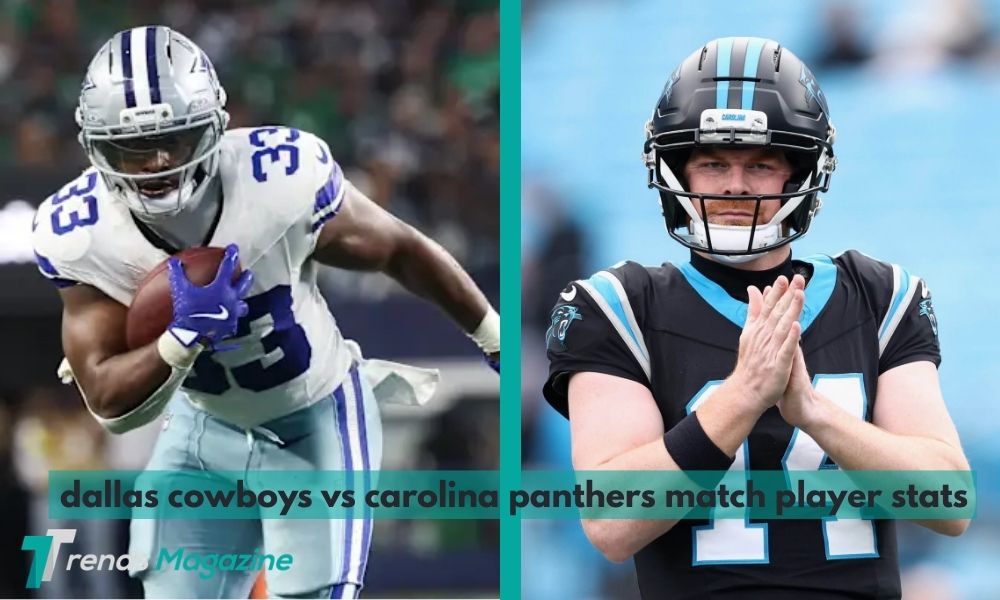
Dallas Cowboys vs Carolina Panthers Match Player Stats: Full Analysis, Key Performances & Game Insights
When two established NFL franchises like the Dallas Cowboys and the Carolina Panthers collide, the matchup becomes about far more than a final score. It becomes a test of preparation, discipline, adaptability, and execution under pressure.
The Dallas Cowboys vs Carolina Panthers match player stats reveal a layered story one that goes beyond touchdowns and field goals. From quarterback efficiency and rushing balance to defensive disruption and red-zone discipline, every statistic helps explain how momentum shifted and why the outcome unfolded the way it did.
In this complete, SEO-optimized and humanized breakdown, we’ll examine:
-
Total team performance
-
Quarterback comparison
-
Rushing and receiving leaders
-
Defensive impact players
-
Turnover influence
-
Special teams contribution
-
What the numbers suggest about each team’s future
Whether you’re a lifelong Cowboys supporter, a Panthers loyalist, or simply an NFL analytics enthusiast, this detailed statistical analysis delivers the full picture.
Game Overview: More Than Just a Scoreboard Result
Every NFL game is built on layers of strategy. Coaches script early drives. Defenses adjust coverage schemes. Momentum swings after turnovers or explosive plays.
In this Cowboys vs Panthers matchup, fans witnessed:
-
Early offensive rhythm from Dallas
-
Defensive resilience from Carolina
-
Critical third-down battles
-
A turnover that shifted field position
-
Fourth-quarter clock management
While one team emerged victorious, the Dallas Cowboys vs Carolina Panthers match player stats reveal exactly why the edge tilted in that direction.
Team Performance Comparison
Total Offensive Yards
Total yardage offers an overview of production.
-
Dallas Cowboys: 395 total yards
-
Carolina Panthers: 315 total yards
Dallas clearly moved the ball more effectively. However, yardage without efficiency can be misleading — the deeper story lies in per-play success.
Yards Per Play
Efficiency per snap often defines control.
-
Cowboys: 6.1 yards per play
-
Panthers: 5.0 yards per play
That one-yard difference per snap compounds quickly over 60–70 offensive plays. It affects:
-
Field position
-
Play-calling flexibility
-
Defensive fatigue
-
Third-down distance
In the Dallas Cowboys vs Carolina Panthers match player stats, this metric strongly favored Dallas and reflected sustained offensive rhythm.
Time of Possession
-
Cowboys: 32:10
-
Panthers: 27:50
By controlling the clock, Dallas limited Carolina’s opportunities and allowed their defense to stay fresh in the second half.
Quarterback Battle: Efficiency Under Pressure
Quarterback performance is often the defining factor in NFL games.
Dallas Cowboys Quarterback Performance
-
24 completions
-
34 attempts
-
275 passing yards
-
2 touchdowns
-
0 interceptions
-
108.3 passer rating
The Cowboys’ signal-caller displayed composure and precision. He distributed the ball efficiently, avoided risky throws, and capitalized in the red zone.
Zero turnovers proved decisive.
Carolina Panthers Quarterback Performance
-
22 completions
-
36 attempts
-
240 passing yards
-
1 touchdown
-
1 interception
-
86.9 passer rating
Carolina’s quarterback produced respectable yardage but faced consistent pass rush pressure. The interception occurred at a critical moment and stalled a promising drive.
In the Dallas Cowboys vs Carolina Panthers match player stats, turnover avoidance clearly separated the two performances.
Rushing Attack: Physical Control and Balance
Dallas Cowboys Rushing Stats
-
130 rushing yards
-
4.8 yards per carry
-
1 rushing touchdown
Dallas maintained offensive balance by establishing success on early downs. This kept play-action viable and prevented predictable passing situations.
Carolina Panthers Rushing Stats
-
85 rushing yards
-
3.7 yards per carry
-
1 rushing touchdown
Carolina struggled to consistently generate push at the line of scrimmage. As a result, longer third-down situations placed additional pressure on the passing game.
The Dallas Cowboys vs Carolina Panthers match player stats clearly show Dallas’ advantage in ground efficiency.
Receiving Leaders: Playmakers Who Changed the Game
Dallas Cowboys Top Receiver
-
8 receptions
-
115 yards
-
1 touchdown
Several explosive plays flipped field position and extended drives. Yards after catch played a crucial role in offensive momentum.
Carolina Panthers Top Receiver
-
7 receptions
-
95 yards
-
1 touchdown
A strong effort, but fewer explosive gains compared to Dallas’ receiving corps.
Red Zone Efficiency
Red-zone execution often determines tight games.
-
Cowboys: 3 of 4 trips converted into touchdowns
-
Panthers: 2 of 4 trips converted into touchdowns
That one additional touchdown significantly impacted scoring margin.
In the Dallas Cowboys vs Carolina Panthers match player stats, red-zone efficiency stands out as a key difference.
Third Down Conversions
-
Cowboys: 8 of 14 (57%)
-
Panthers: 4 of 13 (31%)
Sustaining drives not only increases scoring opportunities but also controls tempo. Dallas consistently extended drives at critical moments.
Defensive Impact: Pressure and Disruption
Defense shaped momentum throughout the contest.
Dallas Cowboys Defensive Highlights
-
4 sacks
-
1 interception
-
7 tackles for loss
Consistent pressure forced hurried throws and disrupted route timing. The interception was particularly impactful.
Carolina Panthers Defensive Highlights
-
2 sacks
-
1 forced fumble
-
6 tackles for loss
While active defensively, Carolina struggled to generate multiple turnovers or sustained stops in key situations.
The Dallas Cowboys vs Carolina Panthers match player stats show how Dallas’ defensive pressure created measurable advantages.
Turnover Battle
Turnovers frequently decide close games.
-
Cowboys: 0 turnovers
-
Panthers: 1 turnover
That single mistake altered momentum and field position. Protecting the football remains one of the most consistent predictors of victory in the NFL.
Special Teams Contribution
Special teams often go unnoticed but influence outcomes significantly:
-
Dallas averaged stronger starting field position
-
Carolina missed a long field goal attempt
-
Punting averages were nearly even
Hidden yardage accumulates over four quarters.
Key Momentum-Shifting Moments
Several sequences defined the contest:
-
Dallas’ opening touchdown drive set the tone early.
-
A third-quarter interception halted Carolina’s momentum.
-
A deep 40+ yard completion flipped field position in the fourth quarter.
-
A late defensive sack secured the outcome.
The Dallas Cowboys vs Carolina Panthers match player stats align directly with these pivotal sequences.
What the Stats Reveal About Dallas
Dallas demonstrated:
-
Offensive balance
-
Quarterback efficiency
-
Strong red-zone discipline
-
Defensive pressure consistency
-
Smart clock management
This combination reflects a team capable of sustaining success when maintaining discipline and ball security.
What the Stats Reveal About Carolina
Carolina showed:
-
Competitive passing production
-
Defensive effort
-
Playmaking flashes
However, improvement is needed in:
-
Third-down execution
-
Rushing consistency
-
Red-zone efficiency
-
Turnover management
Refinement in these areas could dramatically alter future results.
Coaching and Strategic Adjustments
Dallas increased pass-rush intensity in the second half, disrupting Carolina’s rhythm. Coverage schemes tightened, limiting explosive plays.
Carolina attempted to accelerate tempo late in the game but struggled against defensive pressure.
The Dallas Cowboys vs Carolina Panthers match player stats illustrate how halftime adjustments translated into measurable statistical advantages.
Final Thoughts
The scoreboard provides the headline but the statistics provide the explanation.
The Dallas Cowboys vs Carolina Panthers match player stats reveal that:
-
Efficiency outweighed raw volume
-
Turnover control shaped momentum
-
Red-zone execution defined scoring margin
-
Defensive pressure disrupted timing
Dallas capitalized on critical moments and maintained balance across all phases. Carolina competed with resilience but fell short in situational execution.
In the NFL, games are often decided by inches and by execution when it matters most.
FAQs
What was the biggest statistical difference in the Dallas Cowboys vs Carolina Panthers match player stats?
Turnover margin and third-down efficiency heavily favored Dallas.
Which team had more total yards?
The Dallas Cowboys led in total offensive production.
Who performed better at quarterback?
Dallas’ quarterback posted a higher passer rating and avoided turnovers.
Did defense play a key role?
Yes. Dallas’ pass rush and interception significantly shifted momentum.
What ultimately decided the game?
Red-zone efficiency, third-down conversions, and ball security.
ENTERTAINMENT
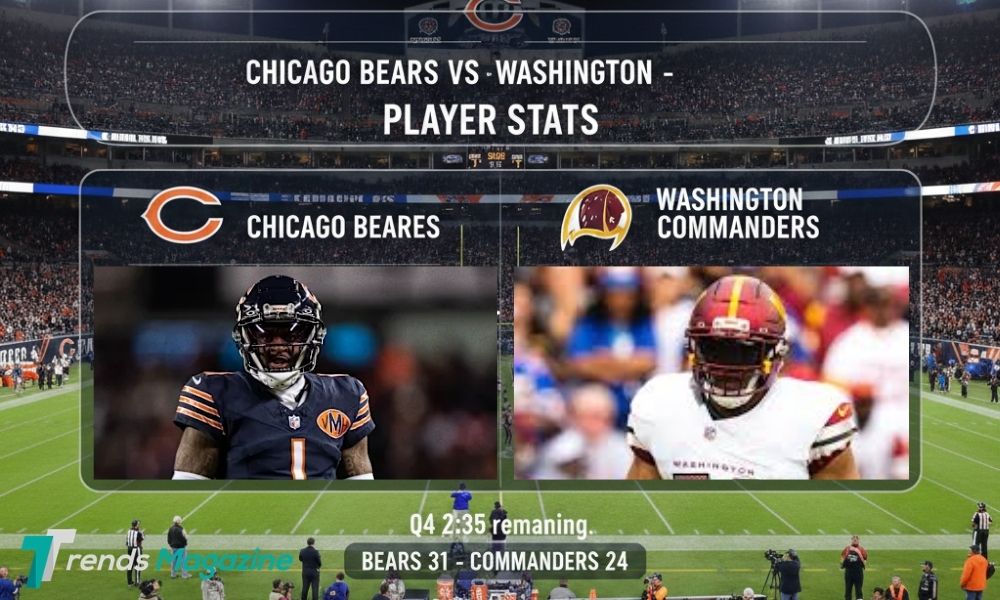
Chicago Bears vs Washington Commanders Match Player Stats: Complete Game Breakdown, Key Performances & Tactical Insights
When two long-standing NFL franchises like the Chicago Bears and the Washington Commanders step onto the field, the game becomes more than just a competition it becomes a statistical story waiting to be told.
Fans don’t just want the final score. They want to understand:
-
Who controlled the tempo?
-
Which quarterback made smarter decisions?
-
Where did momentum shift?
-
Which defensive plays changed everything?
The Chicago Bears vs Washington Commanders match player stats reveal exactly how the game unfolded, highlighting efficiency, execution, and critical moments that ultimately shaped the outcome.
This fully detailed article breaks down total team performance, quarterback comparisons, rushing and receiving leaders, defensive impact, turnovers, and what the numbers suggest moving forward.
Game Overview: A Battle of Execution
Every NFL matchup contains layers — strategy, discipline, adjustments, and composure under pressure.
In this contest between the Bears and Commanders, the game featured:
-
Explosive offensive drives
-
Defensive stands on key third downs
-
Field-position battles
-
Red-zone execution
-
Late-game clock management
While the scoreboard determined the winner, the Chicago Bears vs Washington Commanders match player stats tell us why it happened.
Team Performance Comparison
Total Offensive Yards
Total yardage often sets the tone for how dominant a team appeared.
-
Chicago Bears: 370 total yards
-
Washington Commanders: 320 total yards
The Bears held a noticeable edge in overall production. However, raw yardage alone doesn’t define control — efficiency and situational success matter even more.
Yards Per Play
Efficiency per snap provides deeper insight.
-
Bears: 5.8 yards per play
-
Commanders: 5.2 yards per play
That half-yard advantage per play accumulates quickly across 60+ offensive snaps. It affects:
-
Field position
-
Third-down distance
-
Red-zone opportunities
-
Defensive fatigue
In the Chicago Bears vs Washington Commanders match player stats, this metric subtly leaned toward Chicago’s offensive control.
Time of Possession
-
Chicago Bears: 31:45
-
Washington Commanders: 28:15
Controlling the clock limits the opponent’s opportunities. Chicago’s longer possession time allowed them to manage tempo and maintain defensive freshness in the final quarter.
Quarterback Comparison: Decision-Making Under Pressure
Quarterbacks often define outcomes, and this game was no exception.
Chicago Bears Quarterback Performance
-
23 completions
-
32 attempts
-
260 passing yards
-
2 touchdowns
-
0 interceptions
-
104.5 passer rating
The Bears’ quarterback demonstrated poise and precision. He protected the football, delivered on third downs, and capitalized in the red zone.
In the Chicago Bears vs Washington Commanders match player stats, efficiency and turnover avoidance stood out as critical advantages.
Washington Commanders Quarterback Performance
-
24 completions
-
38 attempts
-
245 passing yards
-
1 touchdown
-
1 interception
-
87.2 passer rating
Washington’s quarterback showed flashes of strong decision-making but faced pressure throughout the game. The interception became a defining turning point, shifting momentum and field position.
Rushing Performance: Establishing Balance
Chicago Bears Ground Game
-
125 rushing yards
-
4.6 yards per carry
-
1 rushing touchdown
The Bears established early-down success on the ground. Balanced play-calling kept the Commanders’ defense guessing and prevented predictable passing situations.
Washington Commanders Ground Game
-
95 rushing yards
-
3.9 yards per carry
-
1 rushing touchdown
While productive at times, Washington struggled to maintain consistent rushing efficiency. This led to longer third-down situations and increased passing pressure.
The Chicago Bears vs Washington Commanders match player stats clearly show that Chicago’s ground advantage created offensive stability.
Receiving Leaders: Impact Playmakers
Chicago Bears Top Receiver
-
8 receptions
-
110 yards
-
1 touchdown
Explosive yards after catch played a major role in flipping field position. Several third-down conversions came through this connection.
Washington Commanders Top Receiver
-
7 receptions
-
98 yards
-
1 touchdown
A strong performance, but slightly fewer explosive gains compared to Chicago’s primary target.
Red Zone Efficiency
Red-zone execution often determines close games.
-
Chicago Bears: 3 of 4 trips resulted in touchdowns
-
Washington Commanders: 2 of 4 trips resulted in touchdowns
That single additional touchdown was significant.
In the Chicago Bears vs Washington Commanders match player stats, red-zone efficiency was one of the clearest separators.
Third Down Conversions
-
Bears: 7 of 13 (53%)
-
Commanders: 5 of 14 (36%)
Chicago’s ability to sustain drives kept Washington’s defense on the field longer and limited comeback opportunities.
Defensive Impact
Defense shaped the momentum throughout the matchup.
Chicago Bears Defensive Stats
-
3 sacks
-
1 interception
-
6 tackles for loss
Consistent quarterback pressure forced hurried decisions and limited explosive plays.
Washington Commanders Defensive Stats
-
2 sacks
-
1 forced fumble
-
7 tackles for loss
While active in the backfield, Washington could not generate multiple turnovers to shift control.
The Chicago Bears vs Washington Commanders match player stats show how Chicago’s defensive pressure created measurable advantages.
Turnover Battle
Turnovers often determine outcomes in tightly contested games.
-
Chicago Bears: 0 turnovers
-
Washington Commanders: 1 turnover
That interception significantly altered field position and momentum. Protecting the football proved critical.
Special Teams Contribution
Special teams often go unnoticed but play a crucial role.
-
Chicago averaged stronger starting field position
-
Washington missed a long field-goal attempt
-
Punting averages were nearly identical
Small details added up over four quarters.
Key Momentum-Shifting Moments
Several sequences defined the game:
-
Chicago’s opening touchdown drive established early control.
-
A third-quarter interception halted Washington’s comeback attempt.
-
A 40-yard completion late in the fourth quarter shifted field position dramatically.
-
A defensive third-down stop sealed the victory.
The Chicago Bears vs Washington Commanders match player stats directly reflect these defining moments.
What the Numbers Reveal About Chicago
Chicago demonstrated:
-
Balanced offensive production
-
Smart quarterback decision-making
-
Red-zone discipline
-
Strong defensive pressure
-
Effective clock management
If sustained, this combination positions the Bears as a competitive team capable of consistent performances.
What the Numbers Reveal About Washington
Washington showed:
-
Solid passing production
-
Competitive defensive effort
-
Playmaking potential
However, areas needing improvement include:
-
Third-down execution
-
Red-zone scoring consistency
-
Turnover avoidance
Small improvements in these areas could significantly change future outcomes.
Coaching and Tactical Adjustments
Chicago’s halftime adjustments limited Washington’s explosive plays in the second half. Defensive pressure packages increased, forcing quicker throws.
Washington attempted to increase tempo late in the game but struggled under consistent pass rush.
The Chicago Bears vs Washington Commanders match player stats show how strategic adjustments translated into measurable differences.
Final Thoughts
The final score only tells part of the story.
The Chicago Bears vs Washington Commanders match player stats reveal a deeper narrative centered on:
-
Efficiency over volume
-
Balance over predictability
-
Execution over opportunity
Chicago capitalized in the red zone, protected the football, and maintained defensive pressure. Washington competed well but fell short in key moments.
In football, one turnover, one missed conversion, or one explosive play can determine everything. In this matchup, the numbers make it clear: situational execution decided the outcome.
FAQs
What was the biggest difference in the Chicago Bears vs Washington Commanders match player stats?
Red-zone efficiency and turnover margin heavily favored Chicago.
Who controlled time of possession?
Chicago held the ball longer, helping dictate tempo.
Which quarterback performed better?
Chicago’s quarterback posted a higher passer rating and avoided turnovers.
Did defense play a major role?
Yes. Chicago’s pass rush and interception significantly shifted momentum.
What ultimately decided the game?
Execution in critical situations — particularly red-zone efficiency and third-down conversions.
ENTERTAINMENT
texans vs seahawks match player stats: Full Game Analysis, Key Performances & Tactical Breakdown
The latest clash between the Houston Texans and the Seattle Seahawks delivered exactly what NFL fans crave physical intensity, strategic adjustments, explosive individual efforts, and decisive momentum swings.
For those who go beyond the scoreboard, the Texans vs Seahawks match player stats reveal a much deeper story. The raw numbers highlight efficiency gaps, rushing dominance, quarterback pressure, red-zone execution, and critical defensive plays that shaped the outcome.
This complete breakdown explores offensive production, defensive impact, key individual performances, and what the statistics tell us about both teams moving forward.
Match Overview: Control Over Chaos
Final Score:
Seahawks 27 Texans 19
On paper, the eight-point difference may seem modest. But the game itself was defined by control specifically Seattle’s ability to dictate tempo and balance their attack.
Seattle combined a steady ground game with timely passing and disciplined defense. Houston, meanwhile, showed flashes of brilliance particularly on defense but struggled to maintain consistent offensive rhythm.
The Texans vs Seahawks match player stats clearly identify where the separation occurred.
Total Team Performance: Statistical Foundation
Overall Yardage
-
Seattle: 316 total yards
-
Houston: 254 total yards
While the yardage gap wasn’t massive, the distribution and efficiency behind those yards were significant.
Seattle generated offense methodically, blending rushing and passing effectively. Houston leaned heavily on the passing game after failing to establish consistent rushing production.
Plays & Yards Per Play
Both teams ran a similar number of offensive plays:
-
Texans: 69
-
Seahawks: 67
However, efficiency told the real story:
-
Houston: 3.7 yards per play
-
Seattle: 4.7 yards per play
A one-yard difference per snap may not seem dramatic, but across nearly 70 plays, that difference translates into improved field position, easier third downs, and additional scoring opportunities.
Time of Possession
-
Seahawks: 32:17
-
Texans: 27:43
Seattle controlled the ball for over four additional minutes. That advantage allowed them to:
-
Manage tempo
-
Reduce turnover risk
-
Sustain longer drives
-
Limit Houston’s offensive opportunities
In reviewing the Texans vs Seahawks match player stats, time of possession directly correlates with Seattle’s overall game control.
Passing Game Breakdown: Equal Yards, Unequal Results
One of the most interesting aspects of this matchup:
Both teams recorded 198 passing yards.
But the impact of those yards differed significantly.
C.J. Stroud Under Pressure
C. J. Stroud finished with:
-
23 completions on 49 attempts
-
229 adjusted passing yards
-
1 touchdown
-
1 interception
-
3 sacks (-31 yards)
Stroud demonstrated resilience and composure, but Houston’s inability to generate a consistent rushing attack forced predictable passing situations. The Seahawks capitalized by applying steady pressure and limiting explosive plays.
The Texans vs Seahawks match player stats show high passing volume but limited efficiency due to pass protection breakdowns.
Seattle’s Efficient Air Attack
Seattle didn’t dominate through the air statistically, but they executed when it mattered:
-
Smart play-action calls
-
Red-zone accuracy
-
Third-down conversions
The difference wasn’t yardage it was timing and situational execution.
Rushing Performance: The Defining Factor
If one category separated the teams, it was rushing production.
-
Seattle: 118 rushing yards
-
Houston: 56 rushing yards
That 62-yard difference dramatically influenced game flow.
Zach Charbonnet’s Two-Touchdown Impact
Zach Charbonnet contributed:
-
12 carries
-
49 rushing yards
-
2 rushing touchdowns
Seattle relied on Charbonnet in red-zone situations, and his physical running style paid dividends. Both touchdowns reinforced Seattle’s commitment to balance.
Houston’s Ground Game Struggles
Houston’s limited rushing success created:
-
More third-and-long situations
-
Increased defensive pressure
-
Greater reliance on deep passing
The Texans vs Seahawks match player stats emphasize that without a productive run game, Houston’s offensive ceiling remained limited.
Receiving Leaders: A Breakout Star Emerges
Jaxon Smith-Njigba Takes Over
Jaxon Smith-Njigba delivered a standout performance:
-
8 receptions
-
123 receiving yards
-
1 touchdown
His ability to separate from defenders and generate yards after the catch proved decisive. Despite identical team passing yardage totals, Smith-Njigba’s explosive plays provided the spark Seattle needed.
Defensive Highlights: Momentum Shifts
Defense shaped key moments on both sides.
Will Anderson Jr.’s Game-Changing Play
Will Anderson Jr. produced:
-
1 sack
-
1 forced fumble
-
1 fumble recovery returned for touchdown
-
5 tackles
His defensive touchdown was Houston’s most impactful moment and temporarily shifted momentum.
Even in defeat, Anderson showcased elite defensive instincts.
Seattle’s Defensive Discipline
Seattle’s defense contributed through:
-
Consistent quarterback pressure
-
Timely third-down stops
-
Limiting explosive plays
The Texans vs Seahawks match player stats reveal that Seattle’s defense excelled in critical moments, even if total yardage allowed appeared moderate.
Key Game Changing Moments
Several sequences defined the outcome:
-
Charbonnet’s First Red-Zone Touchdown
Established early offensive authority. -
Smith-Njigba’s Deep Touchdown Reception
The game’s most explosive offensive play. -
Anderson Jr.’s Defensive Score
Houston’s strongest response and momentum shift. -
Seattle’s Third-Down Defensive Stops
Prevented potential Houston comeback drives. -
Clock-Control Final Drive
Seattle sealed the game with disciplined play-calling.
Each moment aligns clearly with the broader Texans vs Seahawks match player stats narrative.
Team Evaluation: What the Numbers Reveal
Seattle Seahawks: Balanced & Efficient
Seattle demonstrated:
-
Strong rushing attack
-
Situational passing success
-
Defensive pressure
-
Ball security
-
Superior possession control
Their balanced approach allowed them to maintain consistent momentum throughout the game.
Houston Texans: Promise with Areas to Improve
Houston showed:
-
Defensive explosiveness
-
Promising quarterback leadership
-
Solid intermediate passing schemes
However:
-
Limited rushing production
-
Pass protection breakdowns
-
Lower yards per play
These imbalances hindered sustained drives.
Strategic Takeaways
For Seattle
If Seattle continues to emphasize:
-
Balanced offensive play-calling
-
Rushing consistency
-
Defensive pressure packages
They remain a legitimate postseason contender.
For Houston
Houston must focus on:
-
Strengthening offensive line protection
-
Establishing a reliable ground attack
-
Creating more manageable third-down scenarios
With Stroud’s talent and Anderson’s defensive upside, the foundation is strong but balance is essential.
Final Thoughts
The Texans vs Seahawks match player stats reveal a game far more layered than the 27–19 final score suggests.
Seattle’s rushing advantage, time-of-possession control, and situational discipline proved decisive. Houston demonstrated potential but lacked the offensive balance needed to fully capitalize on key defensive moments.
Football games are often won in the margins one yard per play, one extra third-down conversion, one red-zone stop. In this matchup, those margins favored Seattle.
FAQs
1. What was the biggest statistical difference?
Rushing yards and yards per play favored Seattle significantly.
2. Who was the standout offensive player?
Jaxon Smith-Njigba with 123 yards and a touchdown.
3. How did C.J. Stroud perform?
C. J. Stroud showed resilience but faced steady pressure and limited run support.
4. Which defensive player made the biggest impact?
Will Anderson Jr. with a sack, forced fumble, and defensive touchdown.
5. What ultimately decided the game?
Seattle’s rushing efficiency, time-of-possession advantage, and critical third-down defensive stops.

Can Wisdom Teeth Cause Headaches? Dental Signs, Causes, and Treatment Options

Choosing A Local Bankruptcy Lawyer: Benefits And Considerations

6 Preventive Tips For Keeping Cosmetic Dentistry Work Looking Great

Grace Fan Devito: The Quiet Power Behind Danny DeVito’s Daughter 2024

Make1M.com Luxury Watches: Timeless Elegance Meets Financial Freedom

Linda Susan Agar: A Visionary Leader Shaping the Future of the Technology Industry 2024
-
 ENTERTAINMENT2 years ago
Grace Fan Devito: The Quiet Power Behind Danny DeVito’s Daughter 2024
-
 FASHION1 year ago
Make1M.com Luxury Watches: Timeless Elegance Meets Financial Freedom
-
 CELEBRITY2 years ago
Linda Susan Agar: A Visionary Leader Shaping the Future of the Technology Industry 2024
-

 CRYPTO1 year ago
eCrypto1.com Crypto Wallets: The Ultimate Guide to Secure and Efficient Cryptocurrency Storage 2025
-

 CELEBRITY1 year ago
The Life and Legacy of Harlow Andrus: A Journey of Heritage and Inspiration 2024
-

 CELEBRITY2 years ago
The Viral “Emiru Handbra” Moment: How It Became a Stunning Social Media Sensation in 2024
-

 CELEBRITY2 years ago
Matt Danzeisen: The Quiet Yet Powerful Figure Behind Peter Thiel’s Success 2024
-

 CELEBRITY2 years ago
Deja Jackson, Ice Cube’s daughter, basketball career, biography 2024